Please Sign In to contact this author.
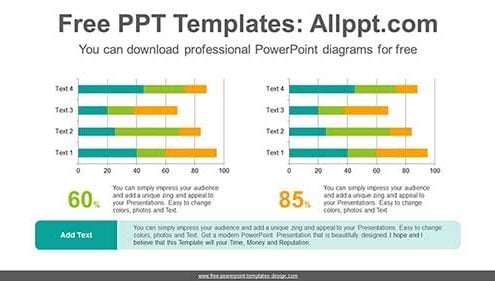
This is a stacked bar chart that compares two pieces of data. A colorful charts has a visual effect. Search Keywords: template, presentation, graph, graphic, icons, infographic,…